#include <qsaxis.h>
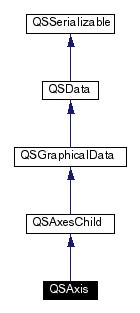
Inheritance diagram for QSAxis:
Public Types | |
| enum | AxisScale { LinearScale, LogScale } |
| enum | AxisRange { RangeSet, RangeVisible, RangeData } |
| enum | AxisType { XAxisType, YAxisType, ZAxisType, VAxisType, UnknownAxisType } |
| enum | Channels { TicsChannel = 0, LineStyles = 1, FontStyles = 2, FillStyles = 3 } |
| enum | LineElement { AxisLine = 0, MajorGridLine, MinorGridLine } |
| enum | FontElement { TitleFont = 0, TicsFont } |
Public Methods | |
| QSAxis (AxisType type, QSAxes *parentAxes, const char *name=0) | |
| virtual | ~QSAxis () |
| double | dataToWorld (double value) const |
| double | worldToData (double value) const |
| AxisType | type () const |
| void | setVisible (bool enabled) |
| void | setOppositePosition (bool enabled) |
| void | setDefaultPosition (bool enabled) |
| void | setReversed (bool reversed) |
| void | setScrollable (bool enabled) |
| bool | visible () const |
| bool | oppositePosition () const |
| bool | defaultPosition () const |
| bool | reversed () const |
| bool | scrollable () const |
| void | setArrow1 (const QSGArrow &arrow) |
| void | setArrow2 (const QSGArrow &arrow) |
| QSGArrow | arrow1 () const |
| QSGArrow | arrow2 () const |
| void | setRange (double min, double max) |
| void | setRangeMin (double min) |
| void | setRangeMax (double max) |
| void | setScale (AxisScale scale, double base=10.0) |
| void | setScaleType (int scale) |
| void | setScaleBase (double base) |
| void | setPosition (double pos) |
| double | min (AxisRange type=RangeSet) const |
| double | max (AxisRange type=RangeSet) const |
| double | rangeMin () const |
| double | rangeMax () const |
| double | scaleBase () const |
| int | scaleType () const |
| double | position () const |
| void | setGridStep (double major=-4.0, double minor=-20.0) |
| void | setMajorGridStep (double step) |
| void | setMinorGridStep (double step) |
| double | majorGridStep () const |
| double | minorGridStep () const |
| const list< QSAxisTic > * | tics () const |
| const QSAxisTic & | lastTic () const |
| void | setTicsVisible (bool visible) |
| void | setTicsOuter (bool enabled) |
| void | setTicsFormat (const QString &format) |
| void | setTicsAngle (int angle) |
| void | setRoundRangeToTicStep (bool enabled) |
| QString | ticsFormat () const |
| int | ticsAngle () const |
| bool | ticsVisible () const |
| bool | ticsOuter () const |
| bool | roundRangeToTicStep () const |
| void | setTicLabelPos1 (double pos) |
| void | setTicLabelPos2 (double pos) |
| double | ticLabelPos1 () const |
| double | ticLabelPos2 () const |
| void | setTitlePosition (double value) |
| void | setTitleDistance (double value) |
| double | titlePosition () const |
| double | titleDistance () const |
| void | sprintfTic (QString &buffer, double value, const QString &format=QString::null) |
| virtual void | rememberCurrentView (int index) |
| virtual void | setRememberedView (int index) |
| void | set_arrow1_property (const QString &data) |
| void | set_arrow2_property (const QString &data) |
| QString | arrow1_property () const |
| QString | arrow2_property () const |
| virtual ColumnType | columnType (int channel, int column) const |
| virtual void | loadStateFromStream (QDataStream &stream, QSObjectFactory *factory) |
| virtual void | saveStateToStream (QDataStream &stream, QSObjectFactory *factory) |
Static Public Methods | |
| void | sprintfTic (QString &buffer, const QString &format, double value, double factor, double base, double exponent) |
Public Attributes | |
| axis_remembered_view_t | rememberedViews [3] |
Static Public Attributes | |
| const double | minLogValue |
| const double | minScaleBase |
| const double | minRangeValue |
| const double | maxRangeValue |
| const double | minRange |
Protected Methods | |
| virtual void | initAxis (double dataMin, double dataMax, bool isData=true) |
Axis. Its main funtion is to map values from data coordinates to world coordinates ( visible range on the axis is mapped to <0,1> ) - see dataToWorld() and from world coordinates to data - see worldToData(). It can also calculate its auto range and tic mark positions, see tics(). initAxis() forces to recalculate all parameters. QSAxes object holds a list of QSAxis child objects. See also QSAxes::CoordinateSystem
|
|
Requested axis range. See min() |
|
|
The axis scale. |
|
|
Type of the axis. |
|
|
Channels. |
|
|
Font elements. |
|
|
Line elements. |
|
||||||||||||||||
|
Constructor. You have to add the axis to the parent child list immediately - see QSAxes::axisAdd() |
|
|
Destructor |
|
|
Returns a begging arrow style |
|
|
Sets an ending arrow style. |
|
||||||||||||
|
Metadata - type of the given column. It should be reimplemented in derived classes. Used to create editors in sheet Reimplemented from QSData. |
|
|
Maps value from an visible axis range to <0,1>. See QSAxes::CoordinateSystem |
|
|
Returns if axis is placed at a default position. |
|
||||||||||||||||
|
This function is called by parent axes each time plot is repainted. It should calculate range, coordinate mappings and tic positions. |
|
|
For internal use. Only |
|
||||||||||||
|
Restores all graphics atributes Reimplemented from QSGraphicalData. |
|
|
Returns a major grid step/density. |
|
|
Returns the axis range . See min() |
|
|
Returns the axis range . Notice that 'RangeSet' may be different from 'RangeVisible'. If you set range to <-10, 10> and turn on 'LogScale' the visible range will be <minLogValue,10>. 'RangeVisible' and 'RangeData' are calculated when plot is redrawn the first time ( parent axes object calls initAxis() ), so returned values may be invalid sometimes. You can call parentAxes()->initMappings() to force recalculation of ranges immediately. |
|
|
Returns a minor grid step/density. |
|
|
Returns whether the axis is placed on the opposite side. |
|
|
Returns the current position. |
|
|
Returns the axis range . See min() |
|
|
Returns the axis range . See min() |
|
|
Remembered view contains such parameters as axis min ,axis max, axis scale, axis reversed. Up to four different views can be remembered ( index must be in 0-3 ). |
|
|
Turns on a reversed direction on a given axis. |
|
|
Returns the adjust setting. |
|
||||||||||||
|
Saves all graphics attributes Reimplemented from QSGraphicalData. |
|
|
Returns the current scale base. |
|
|
Returns the current scale type. |
|
|
Returns a scrollable state |
|
|
Sets a beginng arrow style. |
|
|
Sets an ending arrow style |
|
|
Places an axis at a default position ( opposite or not ). |
|
||||||||||||
|
Sets a new grid density. |
|
|
Sets a new grid step/density. |
|
|
Sets a new grid step/density. |
|
|
Places an axis on the opposite side. |
|
|
Sets a position of the given axis in world coordinates. |
|
||||||||||||
|
Sets the range of the given axis to '< min, max >'. If 'min' == 'max', auto range is turned on. |
|
|
Sets the range of the given axis to '< min, max >'. If 'min' == 'max', auto range is turned on. |
|
|
Sets the range of the given axis to '< min, max >'. If 'min' == 'max', auto range is turned on. |
|
|
Sets the view properties |
|
|
Reverse direction of an axis. |
|
|
Adjust range for the given axis to contain an whole number of tic marks. |
|
||||||||||||
|
Sets the axis scale type. |
|
|
Sets the axis scale type. |
|
|
Sets the axis scale type. |
|
|
Sets if this axis should be scrolled when scrollbars are moved in a plot view.. |
|
|
Sets the distance from the axis of the odd tic labels. |
|
|
Sets the distance from the axis of the even tic labels. |
|
|
Sets the angle of the tic label. |
|
|
Sets the tics print format for the given axis. |
|
|
Outer or inner tic marks.. |
|
|
Sets lengths of tics. |
|
|
Sets the distance of the title from the axis |
|
|
Sets the position of the title ( parallel to the axis ) |
|
|
Hides/shows an axis |
|
||||||||||||||||||||||||||||
|
Makes a text of the tic with value 'value' with format 'format' and writes it to 'buffer'. |
|
||||||||||||||||
|
Makes a text of the tic with value 'value' on axis 'axis' and writes it to 'buffer'. |
|
|
Returns the distance from the axis of the odd tic labels. |
|
|
Returns the distance from the axis of the even tic labels. |
|
|
Tics are generated each time 'initAxis' is called. |
|
|
Returns the tic label angle |
|
|
Returns the label format. |
|
|
Outer or inner tic marks |
|
|
Returns a major tic's length. |
|
|
Returns the distance of the title from the axis |
|
|
Returns the position of the title ( parallel to the axis ) |
|
|
Returns the axis type. |
|
|
Returns if the axis is visible |
|
|
Maps a value from <0,1> to visible axis range. See QSAxes::CoordinateSystem |
|
|
Maximum value shown on the axis. Default is 1e200 |
|
|
Minimum logarithm value. Default is 1e-200 |
|
|
Minimum rangeMax-rangeMin Default 1e-200 |
|
|
Minimum value shown on the axis. Default is -1e200 |
|
|
Minimum value of the logarithm base. Default is 1.001 |
 1.2.14 written by Dimitri van Heesch,
© 1997-2002
1.2.14 written by Dimitri van Heesch,
© 1997-2002