|
KMatplot is a gnuplot-like tool for plotting data sets in either two or three dimensions.
It can plot many types of 2d plots, including pixmaps and contours, and 3d surfaces. It
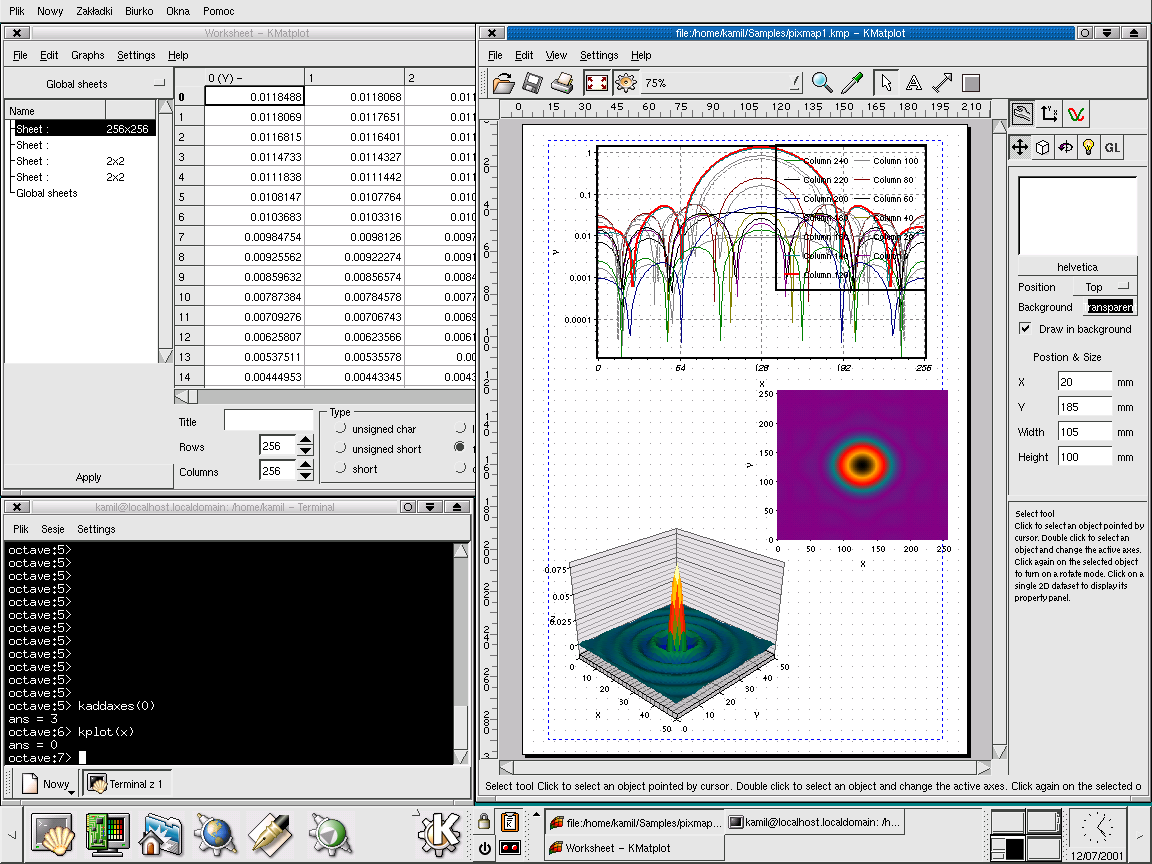
offers a full WYSIWYG mode with multiple objects on a single page. See the screenshot section for more
details.
As opposite to Gnuplot, KMatplot is very clickable, so easier to
use for unexperienced users. It can be used instead of Gnuplot with Octave and Scilab - there are new dll
functions installed in those packages, which communicate with KMatplot through an Unix socket.
Those functions are named 'kplot', 'kimage', kmesh', ... and are similar to those found in Octave
by default.
News:
19.March.2002 KMatplot 0.4 available !
|
|
Main changes:
- new Qt-only GUI, it requires Qt 3.0.1,
- new graph wizard.
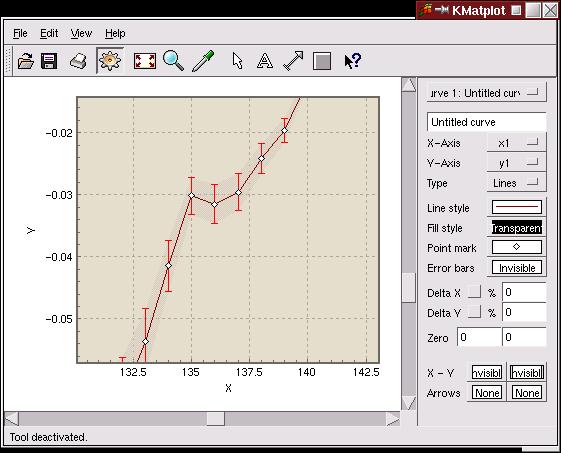
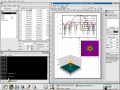
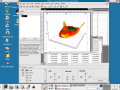
Example kmatplot session screenshot (139 kB)
|
19.Jan.2002 KMatplot 0.3.1 available !
|
|
Main changes:
-
bugfixes,
-
new python module - functions to transfer data from Numeric Python programs
to KMatplot, similar to those for Octave ( Martin Wiechert ),
-
pixmap buffering,
-
updated build system, it should work better under Suse and Debian,
-
examples, see the main menu under Help/Examples.
|
13.Dec.2001 KMatplot 0.3 available !
|
|
Main changes:
- cut/copy/paste,
- undo/redo,
- group/ungroup objects,
- multiple page documents,
- axes can be freely added/removed from a graph,
- formula parser ( still under development ),
- surfaces and contours can display non-gridded data ( using Delunay triangulation ),
- colored area under surface, v-gradient, plotting 4d data ( still under development ),
- custom tics values,
- fast selecting of graph elements by middle button click,
- general data storing policy has changed - vectors are stored as columns,
- many bug fixes.
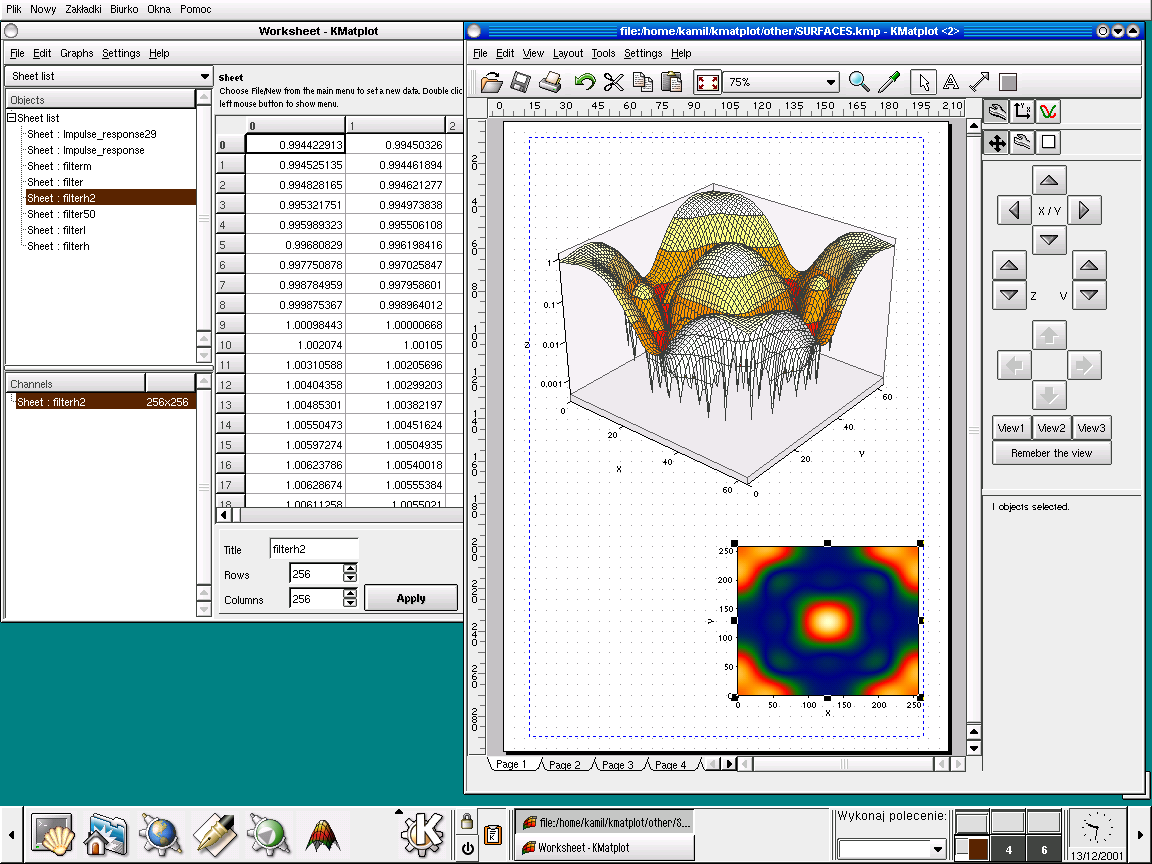
Example kmatplot session screenshot (119 kB)
|
24.Jul.2001 - KMatplot crashes after startup on SuSE
|
|
See download section
|
17.Jul.2001 - binary packages for RedHat i386/Alpha
|
|
See download section
|
12.Jul.2001 - new screenshot !
|
|
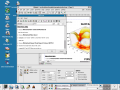
Example kmatplot session screenshot (116 kB)
|
12.Jul.2001 - new CVS snapshot ( see a download section )
|
|
Changes
bugfixes: surfaces use row index, autorun from within Octave and Scilab,
loads/saves arrow styles, no crashing when loading/saving or deleting objects,
Scilab functions updated.
global data sheets.
rulers added to the page view
3d scatter and trajectory plots
|
16.Jun.2001 - new CVS snapshot
|
|
Changes
bugfix: surface plots use row index vector now.
|
1.Jun.2001 - new CVS snapshot
|
|
Changes
exports plots as a pixmap,
loading/saving bugs fixed.
|
|
17.May.2001 - new CVS snapshot
|
|
Changes
just one more try to remove compile time problems.
|
|
15.May.2001 - new CVS snapshot
|
|
Changes
compile time problems ( hopefully ) fixed,
added pixmap and contour gradients,
smoother GUI,
prints pixmaps correctly,
other bugfixes.
|
|
2.May.2001 - mailling list and CVS repository started !
|
|
|
|
|

Lets summarize all features:
- 2D, 3D, pixmap and contour plots,
- full page or single axes view mode,
- easy, interactive label placing and editing,
- zoom and locate tools,
- XML-based native file format,
- imports Matlab MAT1.0 and space separated ASCII data sets,
- exports data in ASCII format,
- optional OpenGL support for 3d plots ( although all functionality is available without it ),
- Postscript printing,
- Octave and Scilab support,
- can plot large datasets,
- worksheet,
- formulas
There is also a widget library, but currently it isn't distributed as a separate library.
See online documentation.
|
|

KMatplot is free software; you can redistribute it and/or modify it under the terms of the GNU General Public License
as published by the Free Software Foundation; either version 2, or (at your option) any later version.
Version 0.4
Requirements:
- Qt 3.0.1,
- MesaGL (3.4.1) or OpenGL library ( recommended, but not required ).
Version 0.3.1
Requirements:
- KDE 2.2,
- MesaGL (3.4.1) or OpenGL library ( recommended, but not required ).
Notice that this code is in a development stage, contains bugs, you may have problems compilling it on your computer
( mine is i386 Red Hat Linux 7.2 ).
Version 0.4
|
Distribution
|
Download URL
|
Comments
|
|
Source TAR.GZ
|
kmatplot-0.4.tar.gz ( 940kB )
|
Installation:
- export QTDIR=/usr/local/qt
- ./configure --prefix=/usr/local
- make install
|
|
Binary files
|
kmatplot-0.4.bin.tar.gz ( 787kB )
|
Installation:
- Copy files to desired location,
- run KMatplot,
- choose Settings/Configure KMatplot from the main menu and change an install path.
Program is linked dynamically to Qt library, it requires other libraries to be present too.
Here is a LDD output:
libqt.so.3 => /usr/local/qt/lib/libqt.so.3
libpng.so.2 => /usr/lib/libpng.so.2
libz.so.1 => /usr/lib/libz.so.1
libjpeg.so.62 => /usr/lib/libjpeg.so.62
libX11.so.6 => /usr/X11R6/lib/libX11.so.6
libresolv.so.2 => /lib/libresolv.so.2
libGL.so.1 => /usr/lib/libGL.so.1
libSM.so.6 => /usr/X11R6/lib/libSM.so.6
libICE.so.6 => /usr/X11R6/lib/libICE.so.6
libXext.so.6 => /usr/X11R6/lib/libXext.so.6
libXi.so.6 => /usr/X11R6/lib/libXi.so.6
libdl.so.2 => /lib/libdl.so.2
libGLU.so.1 => /usr/lib/libGLU.so.1
libXmu.so.6 => /usr/X11R6/lib/libXmu.so.6
libstdc++-libc6.2-2.so.3 => /usr/lib/libstdc++-libc6.2-2.so.3
libm.so.6 => /lib/libm.so.6
libc.so.6 => /lib/libc.so.6
libXrender.so.1 => /usr/X11R6/lib/libXrender.so.1
libXt.so.6 => /usr/X11R6/lib/libXt.so.6
/lib/ld-linux.so.2 => /lib/ld-linux.so.2
|
Version 0.3.1
|
Distribution
|
Download URL
|
Comments
|
|
Source TAR.GZ
|
kmatplot-0.3.1.tar.gz ( 850kB )
|
Notes:
-
Installing and running in a non-default directory
( example dir: ~/kmatplot )
- ./configure --prefix=~/kmatplot
- make install
- export LDLP=$LDLP:~/kmatplot/lib (LDLP stands for LD_LIBRARY_PATH)
- env KDEDIR=~/kmatplot ~/kmatplot/bin/kmatplot
-
KMatplot will crash immediately after start if it doesn't find its resource
files, so it is important to provide a correct KDEDIR (KDEDIRS on Suse) shell
variable if the program is not installed in the default directory. Build system
fails to detect a default KDE path sometimes, especially on Suse. You can
pass KDE path to configure using --prefix option:
./configure --prefix=/opt/kde2
-
If your gcc takes to much system resources when compilling projectxml.cpp file, you
will have to stop compilation ( CTRL+C ), turn off all optimization flags, and start it again
( see below commands ):
export CXXFLAGS="-O0"
./configure
make
-
SUSE 7.3 fails to compile the program returning error:
./aclocal.m4:2508: error: m4_defn: undefined macro: _m4_divert_diversion
Look at offical Suse explanation.
You will have to downgrade autoconf using old SUSE 7.2 packages.
-
Tips for Debian compilation:
Make sure you have the following packages:
kdebase-dev
libqt-gl-dev
octave2.1 (and associates)
configure with:
"./configure --prefix=/usr --with-qgl-extension=/usr/lib/libqt-gl.a"
The --prefix=/usr is there so that kmatplot goes in with all the other KDE
apps and doesn't have any problems finding it's resources.
(Tips from Timothy Harris)
|
|
i386 RedHat 7.2
|
kmatplot-0.3.1-1.i386.rpm ( 1.2MB )
kmatplot-octave-0.3.1-1.i386.rpm
kmatplot-pyhon-0.3.1-1.i386.rpm
|
|
|
SRC RedHat 7.2
|
kmatplot-0.3.1-1.src.rpm ( 1.2MB )
|
|
|
debian sid
|
kmatplot_0.3.1-1_i386.deb ( 769KB )
kmatplot_0.3.1-1_i386.changes
kmatplot_0.3.1-1.dsc
|
Thanks to Laurent Jacques
|
|
Suse 7.3
|
ftp.suse.com
|
Thanks to Suse
|
Previous version:
|


